
Thanks to data mining and the use of simulators, we can determine what makes a good car for the touge.
Table of Contents
An introduction to speed
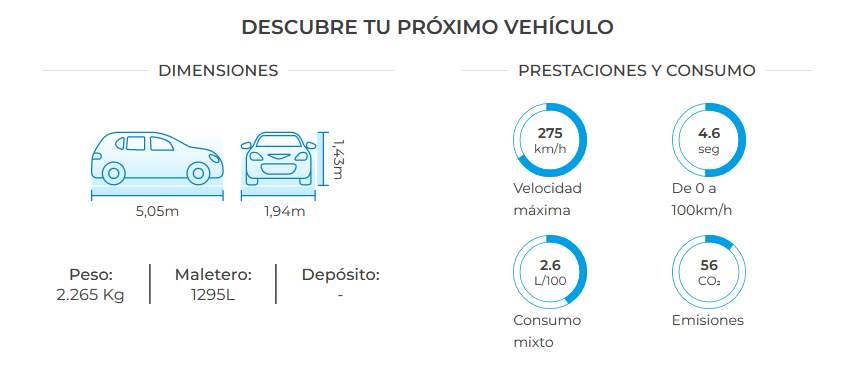
When we talk about a car, and whether it’s considered fast or slow, we usually do so in very simple terms: Acceleration and top speed.
“This car goes from 0 to 100 kph in 8.6 seconds.”
“This car has a top speed of 225 kph.”
This is the formula used by all car manufacturers and salespeople; any dealership will be quick to tell you these figures.
And truth to be told, for highway use, they are more than enough: you want to know at what speed you can merge onto a road or if you will have time to overtake.
However, not all driving occurs on a highway; there are many other disciplines that are contrary to this use.
Touge: Speeding on mountain passes
“Touge” is a Japanese word referring to a mountain road with many curves and elevation changes.
These roads are famous in car culture, especially in Japan, and are iconic for racing and drifting.
All around the world, it’s common to see cars on mountain passes racing late into the night.
The touge is the complete opposite of a highway: a mountain road, full of curves, uneven surfaces, potholes, and narrow paths.
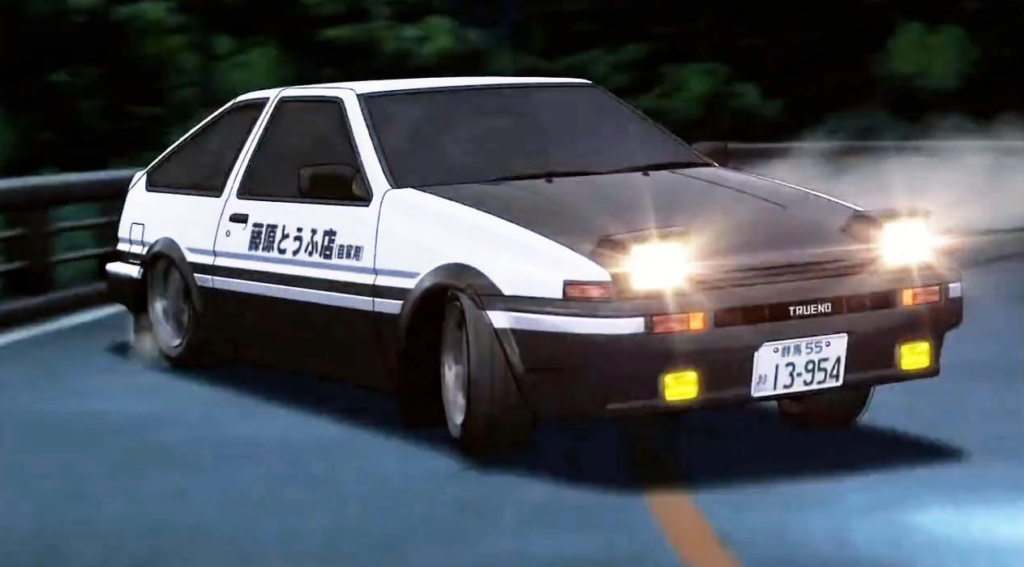
Thanks to pop-culture, specially the anime Initial D, it has become more popular recently:
Driving in mountain passes, at first glance, presents a completely opposite logic to the usual driving on a highway.
Does everything depend on acceleration and top speed?
What factors determine whether a car is fast on mountain roads?
Data mining for answers
Years ago, objectively answering these questions would have been impossible, or at best, would have required years of research by a professional team.
A driver, hundreds of cars and configurations, followed by manually collecting and trying to analyze data without complex algorithms.
Back then this would be challenging for an individual; I’m not a professional driver or backed by a team of scientists and almost-unlimited funds.
Luckily, I have a solid knowledge of data science and access to commercial simulators with realistic physics.
Thanks to this, a single person can conduct various simulations, extracting valuable insights that are not obvious to the human eye.
In this article, I aim to replicate a simpler version of what racing teams do and answer the question: What is the best car for touge racing?
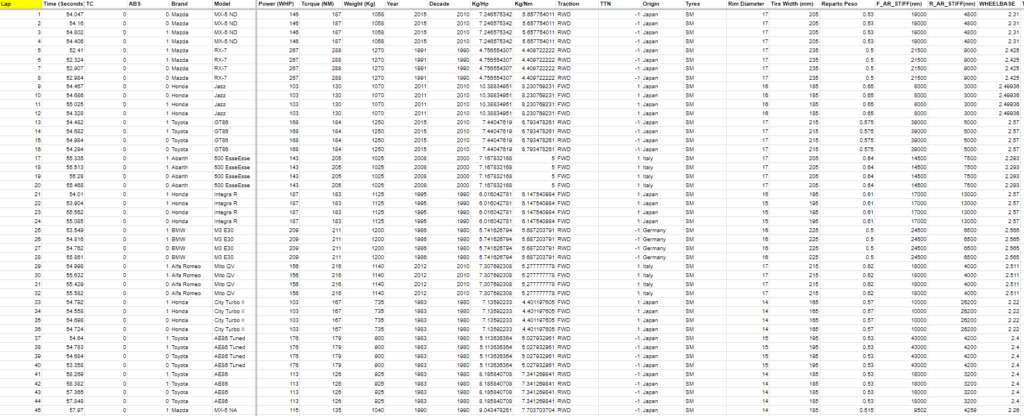
Using simulators with realistic physics, I have completed hundreds of laps on the same track, using different vehicles and configurations.
From all these, I’ve written down their times and various metrics to discover the most important values regarding the time lap.
This way, we use the scientific method to understand what influences my performance as a driver.
With the collected data, we can analyze what affects the lap times.
Is raw power what makes it fast? Weight distribution? The adjustment of the anti-sway bars?
Analysis: What makes a fast touge car?
The data obtained can be divided into two parts: on one hand, we have the time, which is the objective to analyze.
And on the other, we have the data that make up the object of analysis, the attributes: Weight, rims and tyre size, wheelbase and much more.
The key to this analysis will be to first understand which attributes are relevant, that is, which metrics will influence lap times.
We will start by measuring the correlation coefficient between lap time and other attributes.
This allows us to measure the similarity between factors; a positive correlation indicates that the higher the value of a factor, the longer it will take to complete the lap, and a negative one indicates that the higher a factor, the shorter the time.
These are the results:
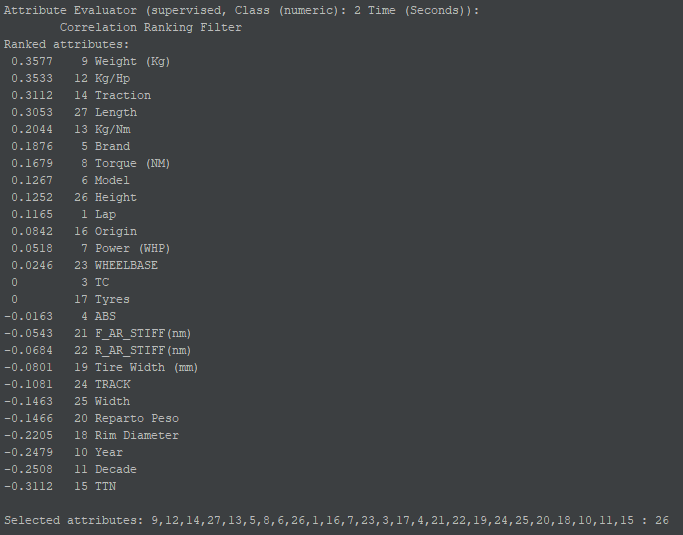
Let’s see which are the 5 most influential values.
- Weight: The heavier the car, the longer the lap time.
- Kg/Hp: Weight-to-power ratio, the higher this ratio, the more kilograms a single horsepower must move, making the lap slower.
- Traction (TTN): FWD and RWD cars were analyzed as they are the most common, 1 for front-wheel drive and -1 for rear-wheel drive, with negative correlation indicating a bias towards rear wheels.
- Length: The longer the vehicle, the worse the time is.
- Year/Decade: Modern chassis tend to offer more rigidity and stability, the newer the year, the better the lap.
As you can see, power, although relevant in relation to weight, is not the most interesting value, and in curves, the main role is played by the size, weight, and structural rigidity of the chassis.
In this sense, the results differ from what is usually commented on the Internet, where priority is often given to weight distribution, traction, and the vehicle being classic.
In addition to the mentioned values, there are several more that deserve a small distinction:
- ABS: The use of ABS does not seem to be relevant for touge racing, having a correlation close to 0.
- Weight Distribution: In the data set, it’s measured as the percentage of weight at the front of the vehicle, the lower this is, the better the result.
Conclusion
With a simple superficial analysis, we can determine which vehicles are better for touge:
Modern, ideally RWD, and lightweight, vehicles from segments B, C, and S.
Of course, this is an ideal scenario, not all conditions can be replicated, neither in real life in legal events nor in the simulator, where often not all boxes can be checked.
At the end, any car will do.
But if you are looking for your next project car, and have mountain roads in your mind, you should consider the 5 key elements described above.
4 comments
Comments are closed.